 |
Our lives are filled with measures, except when it comes to measuring the health of our business processes.
To monitor our physical health, we keep tabs on weight, blood pressure, cholesterol, and other indicators. With our favorite sports teams, we track rankings, batting averages, field goal percentages, and more. With our finances, we keep a watchful eye on our bank balances, interest rates, income, and expenses.
But at work, meaningful measures can be lacking – with people relying on intuition and instinct to tell how things are going.
This is especially the case when it comes to business processes. Staff (and even process owners) will offer opinions when asked about the current “health” of their process. But few will cite quantitative measures that reveal the real health with any precision.
This is a problem, but it’s mostly an opportunity for improvement.
When people learn about process-related measures, they start seeing the connections between different activities and functions.
And when a team begins to track several key measures over time, keeping those numbers front and center week after week, greater ownership takes hold. People start looking for ways to improve their process.
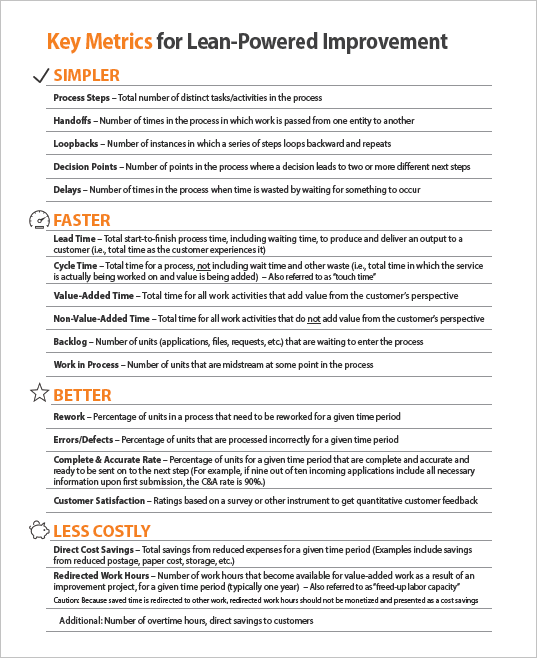
To help with this, we’ve packed our best measurement intelligence into a practical one-pager. It gives you a list of key process-related measures, with plain-language definitions for each. They’re sorted into four categories so you can see how the different measures relate.
You (and your colleagues) can use this one-pager right now. Decide on two or three high-priority measures for your process, gather baseline data, then gather new numbers at regular intervals so you can see trends. Use visuals (like bar charts) to add understanding and impact.
You’ll also use this one-pager when improving a process, whether it’s with a blitz approach like a Kaizen event, or a series of sessions over several weeks. Not all the measures will be relevant, but many will be. The team will want to gather baseline numbers reflecting the health of the current-state process – and put together a separate set of projected numbers to show the expected level of process fitness once the future-state process is in place. These projections serve as improvement targets going forward.
With their new numeric know-how, will staff start cheering on their processes like they cheer on their favorite sports teams?
We won’t go that far. But you can expect to see a better big-picture understanding among staff, more questions on how the process works, and greater interest in making the process simpler, faster, better, and less costly.
Those are some big gains from just a few meaningful measures.
![]()
![]() Download the 1-page handout (PDF 75KB)
Download the 1-page handout (PDF 75KB)
![]()
Contact us
![]() Use the online form
Use the online form
or call 614-571-9529